As a SaaS provider, on occasion, we run into situations where our customers question their usage and bill related to our SaaS offerings. One of the SaaS products I manage helps software publishers and intelligent device manufacturers electronically deliver software updates automatically to end user machines. Our customers are able to lower support calls and costs as a result and also gain valuable insights about their installed base.
Pricing for this product is based on the number of distinct end user machines ("endpoints" for short) that receive software update notifications from the software publisher during a given subscription term; one year, in most cases.
Recently, one of our customers felt that they were overpaying for the service because they did not believe that the number of endpoints reported by our product was accurate. The customer felt they only had 20,000 endpoints whereas our system was reporting 30,000 endpoints which had resulted in a significantly higher bill than what they were expecting. (Note: their actual data is not being used but this illustrates the problem the customer was facing). While such discrepancies are very rare, it can happen.
To resolve such situations, we have developed the following best practices.
Best Practice 1: Easily-understood Usage Metric
Definition of usage metrics should ideally be self-evident to customers. While the notion of endpoints for our product is relatively clear to most of our customers, it still stumps a few. As a result, we take pains to explain it in terms that the customer can relate to. For example, if the publisher's software runs on a server machine, the number of endpoints correlates to the number of servers on which the software in installed. Nonetheless, a few such publishers tell us that they sold far fewer copies of their software during a year compared to what our product was telling them. The explanation could be as simple as customers deploying the software on multiple servers to enable development, test and production environments to something more serious such as software piracy.
Best Practice 2: Self-service Usage Reporting
It is important to avoid surprises at the time of invoicing. As a result, our product features a simple dial that shows the current consumption against purchased quota of endpoints each time our customer logs into the system. Should customers feel things are not aligned with their usage pattern, they can flag it right away to our support organization. It's not only important to provide customers with self-service but to also be completely transparent at all times.
Best Practice 3: Capture Detailed Reporting Data
While customers may never ask for it, we have found it a worthwhile practice to capture and store detailed usage information for each customer. For example, our system captures details such as daily endpoint count, how long a given endpoint was active, the most recent date when a given endpoint called home and so on. An example of such a detailed report is below. This figure shows the number of distinct endpoints that were active for less than 30 days, bucketed by the final month in which the endpoint was active, for the customer mentioned in this article (Note: numbers have been purged to protect privacy). In simple terms, such endpoints represent software that was used for 30 days or less.
Figure 1: Endpoints active for less than 30 days by final month of use
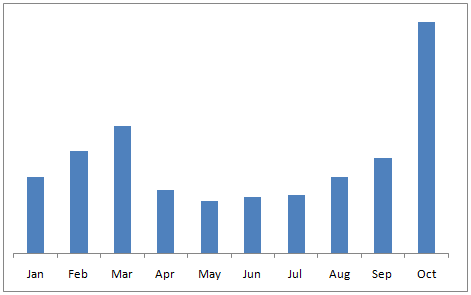
Such a trend has no particular relevance to us but it made complete sense to the customer, and helped them correlate software usage with ebbs and flows in their business, as we point out below.
Best practice 4: Understand the Customer's Story
More than anything else, we have found it useful to engage customers in a discussion of what might explain their usage trends based on the detailed report we provide them. This customer, as it turns out, is a leading manufacturer of farm equipment. Like auto and engine manufacturers, they provide software that helps dealers and repair shops diagnose problems with their engines and equipment. Our software update solution is embedded in the manufacturer's software. According to our customer, the trend displayed in the figure fits well with when they would expect farmers to service their equipment based on the planting and harvest cycles in North America. As farmers get their machines ready for the planting/harvest season starting in April-May, equipment repair activity starts trending upwards in the prior months. Towards September-October, repair activity peaks again because the machines have been used intensely during the summer months and are worse for the wear and tear. In addition, the customer is experiencing strong growth (and hence, software sales) in emerging economies, which as it happens, are also north of the equator (for the most part) and have similar crop cycles as North America. Having this level of detail convinced our customer that their usage level (and resulting bill) was quite consistent with their business.